SoundScope
SoundScope
The official app & game
Distributed by UptoPlay
SCREENSHOTS
DESCRIPTION
Play this online game named SoundScope.
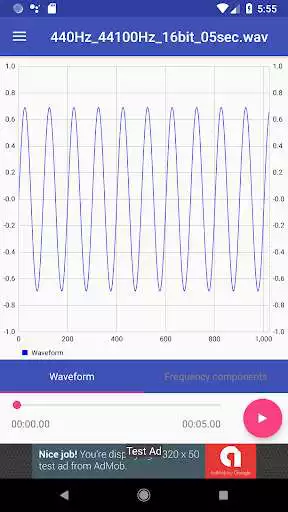
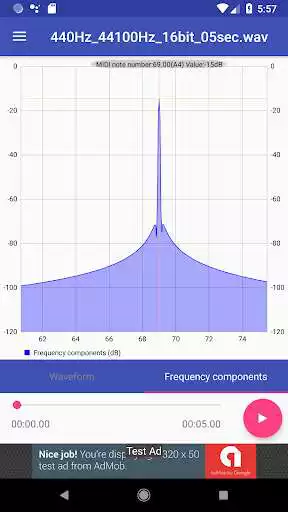
【Overview】Perform frequency analysis (Fast Fourier Transform, FFT) on the audio track included in the file, and display the waveform and frequency components on the chart.
By "visualizing" the sound, it can be used for various purposes.
- Identify the frequency of noise
- Sound quality evaluation of compressed audio file
- Music dictation support
【Corresponding file】
It supports audio files (WAV, MP3, AAC, FLAC etc) that are compatible with Android standard codec or video files including audio tracks.
【Usage】
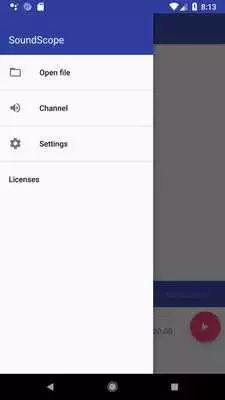
★ Open the menu
Tap "3 line icon" in the title bar to open the menu.
* When the vertical size of the screen is less than 480 dp, the title bar hides, so swipe to the center from the left edge of the screen and display it.
★ Open the file
Select "Open file" from the menu and specify the file to be analyzed.
★ Start playing
When you press "Play button" at the bottom right of the screen, the sound is played.
"Waveform Chart" and "Frequency Components Chart" are updated in real time during playback.
★ Playback start position
You can specify the playback start position by moving "seek bar" at the bottom of the screen.
★ Play speed adjustment
Long press the playback button to adjust the playback speed from 0.1 to 1.0. (* Android 6.0 or later)
★ Audio channel
You can select the audio channel to analyze.
* This function is effective only with stereo sound source.
Open the dialog from the "Channel" of the menu and select from "Stereo", "L + R", "L - R", "Left", "Right".
For example, if you select "L - R", the volume of the vocal, etc. located at the center decreases.
★ Chart switching
To switch the chart, tap the tab at the bottom of the chart.
* If the vertical size of the screen is less than 480 dp, the tab hides, so swipe the chart up or down to switch.
★ Chart marker
Tap the chart to display the marker.
Marker position information (frame position, frequency, etc.) is displayed at the top of the chart.
Tap the chart marker at the same position to turn it off.
★ Chart scale enlargement / reduction
You can pinch out charts or double tap to zoom in, pinch in to zoom out.
★ Chart display position
Swipe left and right with the chart enlarged, you can move the display position of the chart.
★ Chart range limited
You can fix the display position by limiting the maximum and minimum values of the chart horizontal axis.
With the chart zoomed, the range will be limited to "the long press and release moment".
In the limited mode, you can operate the marker position with drag while maintaining the zoom.
If you do the same operation again, the range restriction will be canceled and you will return to the initial mode.
When the mode is changed, a snack bar will be displayed at the bottom of the screen.
★ Chart setting
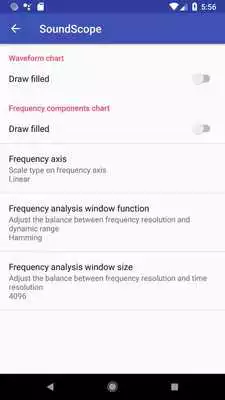
If you select "Setting" from the menu, the setting screen will be displayed.
- Draw Filled
Switch on / off of "Draw Filled" on the chart.
* If "Draw Filled" is on, the drawing speed of the chart will decrease.
- Frequency axis of frequency component chart
Horizontal axis scale of frequency component chart can be specified.
(Linear, logarithm, MIDI note number)
- Window function for frequency analysis
The balance between frequency resolution and dynamic range can be adjusted.
(Rectangular window, Hann window, Hamming window, Blackman window)
- Window size for frequency analysis
The balance between frequency resolution and time resolution can be adjusted.
Increasing the window size increases the frequency resolution but reduces the time resolution.
(512 to 32768)
Updates:
- Adaptive launcher icons compatible- Change how to get chart objects.
(Measures against the phenomenon that the chart is not updated)
- Android 9.0 compatible
SoundScope from UptoPlay.net
Page navigation:


